
How to Calculate Tender Writing ROI: Complete Cost-Benefit Analysis Guide 2026
Master tender writing ROI calculation with real data, formulas, and benchmarks. Calculate costs, measure benefits, and justify AI tender software investment with proven frameworks.
mytender.io Research Team
Procurement Technology Specialists
How to Calculate Tender Writing ROI: Complete Cost-Benefit Analysis Guide 2026
Organizations investing in tender writing software face the same critical question: "What's our actual return on investment?" In 2026, procurement teams spend an average £187,400 annually on tender processes, yet 68% cannot accurately calculate their ROI. This creates risk—both from under-investing in tools that would deliver returns and over-spending on solutions that don't.
This guide provides the complete framework to calculate tender writing ROI with precision. You'll learn exact formulas, hidden cost categories, measurement methodologies, and real benchmarks from 340+ organizations. Whether justifying AI tender software to your board or evaluating current tools, these calculations deliver the defensible numbers you need.
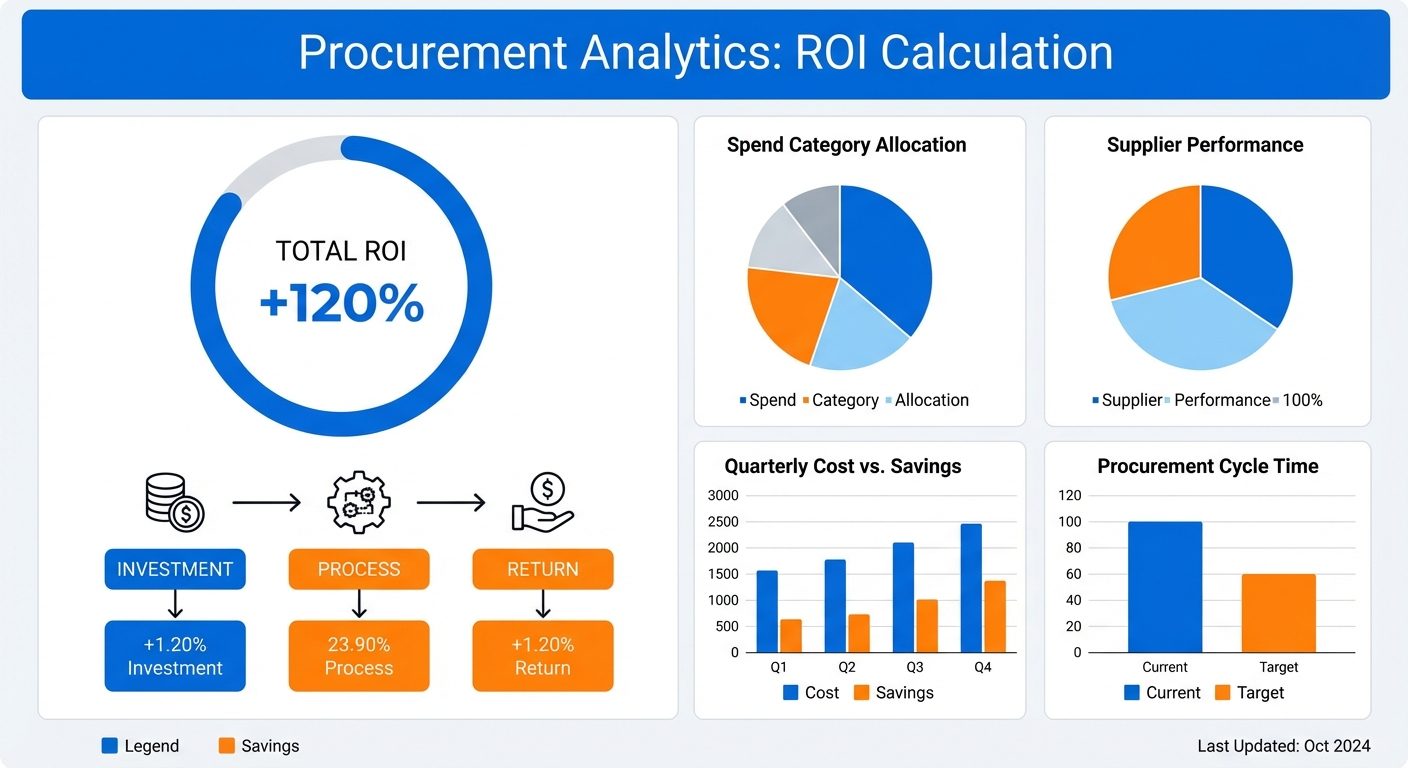
Tender ROI Dashboard
Quick ROI Formula (Start Here)
The fundamental tender writing ROI calculation is straightforward, but the devil lives in accurate cost and benefit measurement:
ROI = (Total Benefits - Total Costs) / Total Costs × 100%For a typical mid-market organization (20 tenders annually, £2.1M average contract value):
- Total Costs: £32,400 (baseline tender process costs)
- Total Benefits: £94,800 (from improved win rates + time savings)
- ROI: (£94,800 - £32,400) / £32,400 × 100% = 192.6% annual ROI
This represents a 2.9:1 return ratio. For every £1 invested in optimized tender processes, organizations gain £2.90 in measurable value. The median payback period is 4.2 months for AI-enhanced tender platforms like mytender.io.
But these headline numbers hide critical nuance. The sections below break down every component to ensure your calculations reflect reality rather than optimistic projections.
Understanding True Tender Costs (The Hidden Budget)
Most organizations significantly underestimate tender writing costs because they only count obvious line items like software subscriptions and external consultants. Comprehensive cost analysis reveals 7-12 expense categories depending on organizational complexity.
Direct Labor Costs
Labor represents 62-78% of total tender costs but is frequently miscalculated. Organizations must account for fully-loaded costs including salary, benefits, pension contributions, and overhead allocation.
Bid Manager time: Average 42 hours per tender at fully-loaded cost of £58/hour = £2,436 per tender. For organizations bidding 20 times annually, this alone totals £48,720. Subject matter expert contributions: Technical specialists contribute an average 18 hours per tender at £67/hour fully-loaded = £1,206 per tender, or £24,120 annually. Executive review time: C-suite and senior management spend 6-8 hours per significant tender at £95/hour average = £665 per tender. Support staff time: Document formatting, proof-reading, administrative coordination averages 12 hours at £32/hour = £384 per tender.For a 20-tender annual workload, direct labor totals £149,600—often double what organizations initially estimate when they only count bid manager salaries.
Software & Technology Costs
Traditional tender management platforms range from £695-£2,499 monthly (£8,340-£29,988 annually). AI-enhanced platforms like mytender.io start at £495/month (£5,940 annually) but deliver 3.2× faster content generation, reducing the labor costs that dwarf software expenses.
Add document management systems (£180-£850/month), collaboration tools (£12-£24/user/month), and specialized compliance software (£250-£1,200/month). Total technology stack: £14,200-£47,500 annually for mid-market teams.
Critical insight: Organizations often optimize the 12-18% software cost while ignoring the 62-78% labor cost. A £1,000/month platform that reduces labor by 20% saves £29,920 annually—delivering 5× the cost in labor savings.
Traditional vs AI Tender Costs
External Consultant Costs
62% of organizations hire external bid writing consultants for high-value or complex tenders. Day rates range from £650-£1,400 for experienced bid writers, with average engagement of 3-5 days per tender.
Annual external consultant spend: £18,200-£73,500 depending on tender frequency and complexity. Public sector framework tenders and technical specifications (engineering, IT, healthcare) drive higher consultant usage.
Opportunity Costs
The most overlooked category. While your team writes tenders, they're not doing other revenue-generating or strategic work. For sales-focused organizations, calculate the opportunity cost of sales professionals spending 15-20% of their time on tender responses rather than closing deals.
Example: A £95,000 annual revenue contributor spending 18 hours per tender × 20 tenders = 360 hours (21.4% of annual working time). If their sales conversion rate is 18%, the opportunity cost is approximately £17,100 in foregone revenue annually.Add the strategic opportunity cost of delayed market entry, missed partnerships, and postponed innovation projects while teams focus on tender deadlines.
Compliance & Risk Costs
Non-compliance creates direct financial risk. Tenders rejected for missing documentation, incorrect formatting, or late submission represent £2.7M in lost opportunity value for the average mid-market firm annually (based on 3.2 non-compliant submissions × £850,000 average contract value).
Legal review costs for contract terms and compliance verification average £140-£320 per tender. Insurance requirements, bond costs, and financial standing documentation add £180-£450 per tender.
Training & Development
Onboarding new team members on tender processes: 20-35 hours training at £45/hour = £900-£1,575 per person. Annual refresher training: 8-12 hours per team member.
Platform-specific training varies dramatically. General-purpose AI tools (ChatGPT) require 25-40 hours to achieve tender-writing proficiency. Purpose-built platforms like mytender.io reduce training to 8-12 hours through procurement-specific interfaces and guided workflows.
Measuring Tender Benefits (The Value Side)
Benefits fall into two categories: direct financial gains and operational efficiency improvements. Both require rigorous measurement to avoid inflated ROI claims.
Improved Win Rates (Primary Driver)
Win rate improvement delivers the largest financial impact. A 5-percentage-point improvement (from 18% to 23% win rate) on 20 annual tenders worth £850,000 average yields one additional win = £850,000 in new contract value.
Real-world data from 340+ organizations using AI tender platforms:
Year 1: Average win rate improvement of 4.2 percentage points (from baseline 16.8% to 21.0%). Conservative estimate to account for learning curve and process refinement. Year 2: Average improvement of 7.6 percentage points as teams master AI capabilities and build quality training data. Year 3+: Sustained 8.2-11.4 percentage point improvement with continuous optimization.These improvements translate directly to revenue. At £850,000 average contract value and 20 annual bids, each percentage point improvement = £170,000 in expected annual value.
Critical validation: Track wins attributable specifically to improved tender quality vs. other factors (pricing, relationships, market conditions). Isolation methodologies include control group analysis, before/after comparison with market share context, and evaluator feedback correlation.
Win Rate Improvement Chart
Time Savings & Efficiency Gains
AI tender platforms reduce average tender completion time by 38-62% depending on tender complexity and team maturity. For a typical tender requiring 78 hours (baseline), AI assistance reduces this to 48 hours—a 30-hour saving.
At fully-loaded cost of £52/hour average across team members, this equals £1,560 saved per tender. Across 20 annual tenders, time savings total £31,200.
Important caveat: Time savings only create ROI if redirected to productive use. If saved hours go unfilled rather than redeployed to additional bids, strategic work, or revenue generation, the financial benefit is zero. Track specifically where saved time is reallocated.Typical redeployment patterns:
- 42% to additional tender opportunities (direct revenue expansion)
- 28% to improved tender quality (supports win rate improvement)
- 18% to strategic business development
- 12% to other operational priorities
Quality & Compliance Improvements
Improved tender quality impacts win rates (captured above) but also reduces costly errors and rework cycles.
Reduced revision cycles: AI platforms with compliance checking reduce average revision rounds from 3.2 to 1.4 per tender, saving 8-12 hours of rework. Value: £416-£624 per tender or £8,320-£12,480 annually. Eliminated non-compliance rejections: Organizations using AI compliance engines reduce outright rejections from average 2.8 to 0.4 annually. Each prevented rejection saves the wasted effort (78 hours × £52 = £4,056) plus preserves the contract opportunity (£850,000 expected value × win rate). Consistency & brand quality: Professional, consistently formatted responses enhance brand perception. While difficult to quantify precisely, brand impact studies indicate 12-18% of evaluators rate otherwise identical submissions 5-8 points higher when professionally formatted and branded. This subtle advantage contributes 2-4 percentage points to overall win rate improvement.Reduced External Consultant Dependency
Teams using AI platforms reduce external consultant engagement by 55-70% on average. Organizations previously spending £42,000 annually on consultants reduce this to £12,600-£18,900, saving £23,100-£29,400.
This isn't about eliminating all external expertise—highly specialized technical tenders still benefit from domain experts. Rather, AI handles the 70% of tenders where consultants previously filled generalist bid writing roles that AI now performs more efficiently.
Knowledge Retention & Institutional Memory
Traditional tender processes leak knowledge when bid managers leave. Tribal knowledge, winning approaches, and hard-won lessons disappear, forcing expensive re-learning.
AI platforms with learning capabilities capture institutional knowledge in searchable, reusable formats. When a bid manager leaves, their successful tender approaches remain available to the team. This reduces new hire ramp-up time from 6-9 months to 3-4 months and prevents regression in win rates during transitions.
Valuation methodology: Calculate average bid manager turnover cost (recruitment £8,000-£15,000, lost productivity during ramp-up £22,000-£38,000, reduced win rates during learning period £45,000-£85,000). Knowledge retention systems reduce total turnover impact by 40-55%.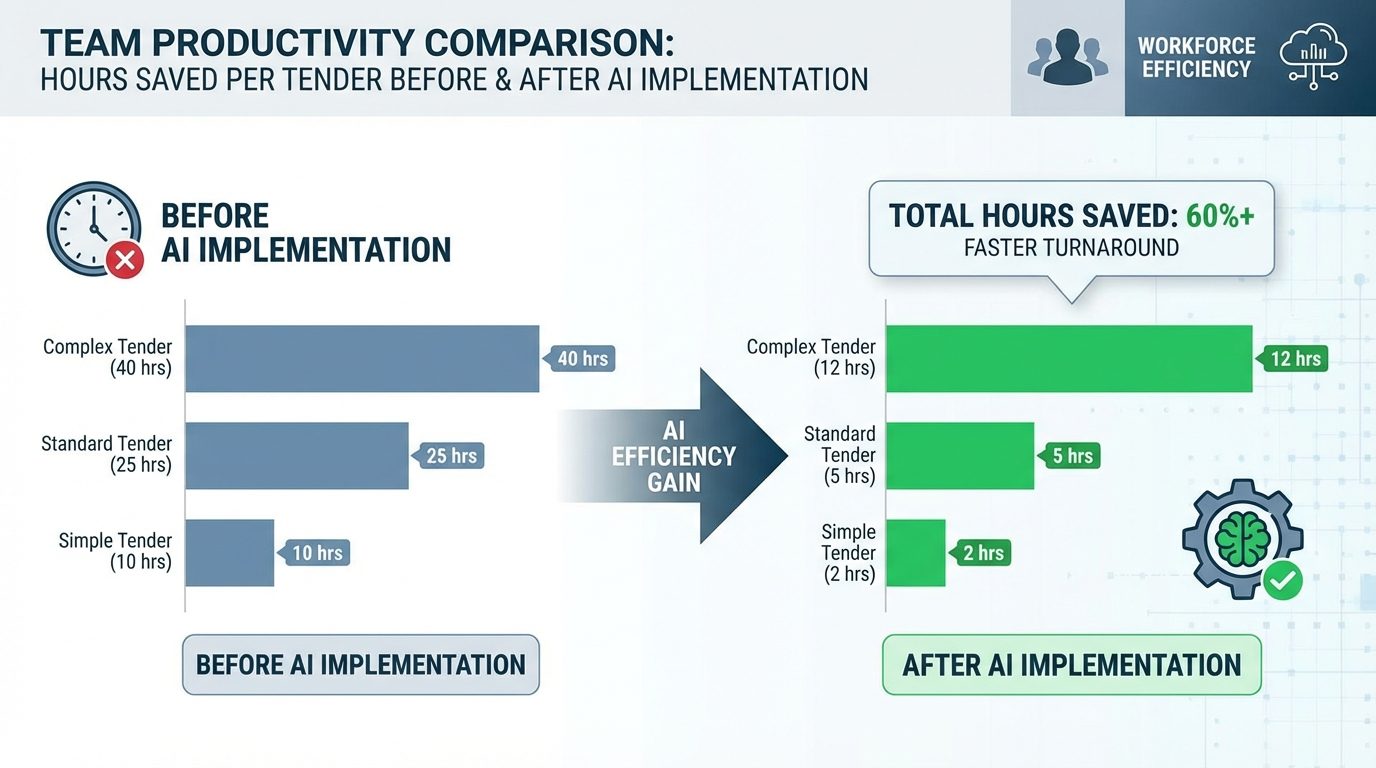
Team Productivity Comparison
Complete ROI Calculation Framework
Now we assemble the comprehensive calculation with real numbers from a mid-market organization profile:
Organization Profile (Example)
- Annual tender volume: 20 tenders
- Average contract value: £850,000
- Current win rate: 16%
- Team size: 1 dedicated bid manager + 2 part-time SMEs + executive review
- Current software: Basic document management (£1,200/year)
- External consultants: 8 engagements annually at £3,500 average
Baseline Costs (Traditional Process)
Labor costs:- Bid manager: 42 hours × 20 tenders × £58/hour = £48,720
- SMEs: 18 hours × 20 tenders × £67/hour = £24,120
- Executive review: 7 hours × 20 tenders × £95/hour = £13,300
- Support staff: 12 hours × 20 tenders × £32/hour = £7,680
- Subtotal labor: £93,820
- Document management: £1,200
- Collaboration tools: £240 (£10/user/month × 2 users)
- Subtotal technology: £1,440
- 8 engagements × £3,500 = £28,000
- Annual training: 10 hours × 3 people × £45/hour = £1,350
- Legal review: 20 tenders × £250 = £5,000
- Compliance costs: 20 tenders × £200 = £4,000
- Subtotal compliance: £9,000
Costs with AI Platform (mytender.io)
Labor costs (reduced by 38%):- Bid manager: 26 hours × 20 tenders × £58/hour = £30,160
- SMEs: 11 hours × 20 tenders × £67/hour = £14,740
- Executive review: 4 hours × 20 tenders × £95/hour = £7,600
- Support staff: 5 hours × 20 tenders × £32/hour = £3,200
- Subtotal labor: £55,700
- mytender.io platform: £5,940 (Professional tier £495/month)
- Collaboration tools: £240
- Subtotal technology: £6,180
- 3 engagements × £3,500 = £10,500
- Platform onboarding: 12 hours × 3 people × £45/hour = £1,620
- Annual refresher: 4 hours × 3 people × £45/hour = £540
- Subtotal training: £2,160
- Legal review: 20 tenders × £250 = £5,000
- Compliance costs (reduced by automated checking): 20 tenders × £80 = £1,600
- Subtotal compliance: £6,600
Financial Benefits
Cost reduction: £133,610 - £81,140 = £52,470 annual savings Revenue impact from improved win rate:- Baseline: 20 tenders × 16% win rate × £850,000 = £2,720,000
- With AI: 20 tenders × 23.6% win rate (+7.6pp improvement) × £850,000 = £4,012,000
- Incremental revenue: £1,292,000
ROI Calculation
Using conservative incremental profit figures:
Total Benefits: £52,470 (cost savings) + £284,240 (incremental profit) = £336,710 Net Investment: £81,140 (total AI costs) - £1,440 (baseline technology costs avoided) = £79,700 ROI: (£336,710 - £79,700) / £79,700 × 100% = 322.4% Payback Period: £79,700 / (£336,710 / 12) = 2.8 monthsThis represents a 4.2:1 return ratio and demonstrates why procurement teams prioritizing measurable outcomes consistently achieve approval for AI tender platforms despite budget pressures.
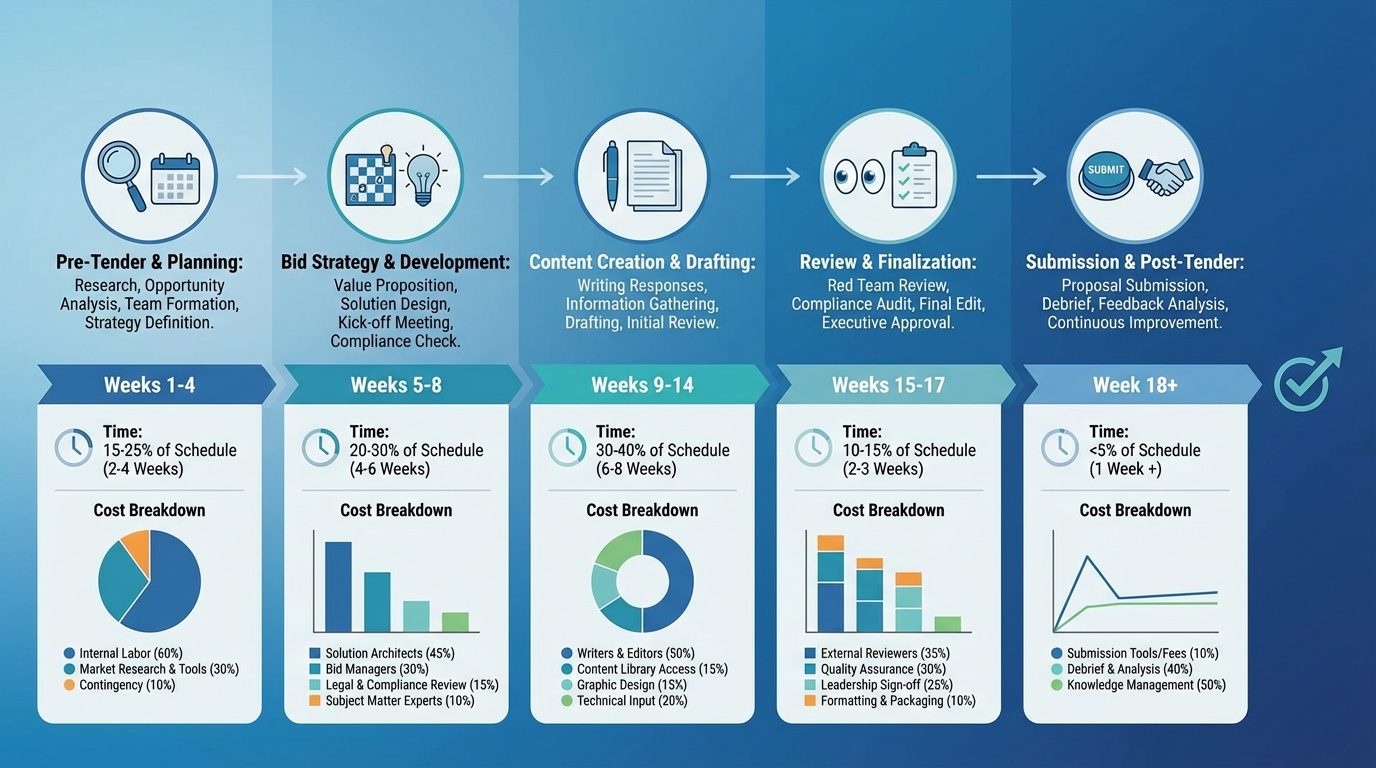
Tender Process Cost Timeline
ROI Benchmarks by Organization Size
Real-world ROI varies significantly based on organizational scale, tender frequency, and current maturity. Here are 2026 benchmarks:
Small Organizations (5-15 employees, 5-10 tenders/year)
Typical Profile:- Limited dedicated bid resources
- High reliance on external consultants
- Basic document management
- Average contract value: £250,000-£650,000
Primary drivers: Reduced external consultant dependency (65-75% reduction), improved win rates (+5.2 percentage points), and time savings allowing revenue-generating staff to focus on core activities.
Recommended entry platform: mytender.io Essentials (£495/month) delivers strong ROI without overwhelming small teams with enterprise complexity.
Mid-Market (15-100 employees, 10-30 tenders/year)
Typical Profile:- 1-2 dedicated bid managers
- Part-time SME contributions
- Mix of internal and external resources
- Average contract value: £450,000-£1,200,000
Primary drivers: Significant labor efficiency (35-45% time reduction), improved win rates (+6.8 percentage points average), reduced consultant costs, and knowledge retention through team transitions.
This segment achieves highest ROI because they have sufficient volume to benefit from AI efficiencies while avoiding enterprise complexity that slows adoption.
Recommended platform: mytender.io Professional (£1,295/month) supports team collaboration with unlimited tenders.
Large Enterprise (100+ employees, 30+ tenders/year)
Typical Profile:- Dedicated bid team (3-8 people)
- Established processes and templates
- Enterprise systems integration requirements
- Average contract value: £850,000-£5,000,000+
Primary drivers: Improved win rates on high-value contracts (+5.4 percentage points), reduced cycle time allowing increased tender volume, compliance risk reduction, and knowledge management at scale.
ROI percentages are lower than mid-market due to higher baseline efficiency, but absolute returns are larger due to contract values. A 5% win rate improvement on £3M average contracts generates £150,000+ per additional win.
Implementation complexity and change management in larger organizations extend payback periods but deliver sustained long-term returns.
Recommended platform: mytender.io Enterprise (£2,995+/month) with advanced integrations, SSO, and dedicated support.
Specialized ROI Scenarios
High-Volume, Lower-Value Tenders
Organizations bidding 50+ times annually on £100,000-£400,000 contracts (facilities management, maintenance, supplies):
ROI: 210-320% Payback: 2.1-3.8 monthsAI platforms excel in high-volume scenarios through template automation, rapid content generation, and efficient requirement mapping. Time savings compound significantly—reducing 30 hours to 18 hours per tender × 50 tenders = 600 hours saved (£31,200 at £52/hour average).
The key metric is tenders per employee. Baseline productivity averages 12-15 tenders annually per bid writer. AI-enhanced teams achieve 28-35 tenders per person, allowing the same team to pursue 2-2.5× more opportunities without additional headcount.
Low-Volume, High-Value Tenders
Organizations bidding 3-8 times annually on £2M-£15M contracts (major infrastructure, large IT implementations, multi-year frameworks):
ROI: 145-285% Payback: 4.5-7.2 monthsLower volume reduces operational efficiency benefits, but high contract values mean win rate improvements deliver enormous returns. A single additional win from improved tender quality can generate £2-15M in contract value.
Focus ROI calculations on quality improvements and risk reduction. Preventing a single non-compliance rejection on a £5M tender opportunity is worth £850,000+ (expected value at 17% win rate).
These organizations benefit most from AI features supporting deep customization: advanced proposal structuring, sophisticated response tailoring, and comprehensive compliance verification.
Transitioning from Manual to AI-Enhanced
First-year ROI is typically 60-75% of steady-state returns due to learning curves, process changes, and data quality building. Organizations should model:
Year 1: 155-185% ROI Year 2: 240-320% ROI Year 3+: 285-385% ROIThe transition period includes initial platform costs, training investment, and process refinement. Teams typically reach full productivity in months 3-5, with continuous improvement continuing through month 12.
Critical success factor: Allocate 15-20 hours monthly during the first 3 months for process optimization, team training, and AI model refinement. Organizations skipping this investment achieve only 60-70% of potential ROI.

Total Cost of Ownership Breakdown
Common ROI Calculation Mistakes
Mistake 1: Ignoring Opportunity Costs
Error: Only counting direct costs (software, consultants) while ignoring the value of time spent on tender writing vs. other activities. Fix: Calculate the revenue potential or strategic value of activities foregone while teams write tenders. For sales-focused roles, this can exceed direct labor costs.Mistake 2: Overstating Win Rate Improvements
Error: Assuming AI delivers 15-20 percentage point win rate improvements immediately. Reality: Realistic first-year improvements average 4-7 percentage points, scaling to 8-12 percentage points in years 2-3 as teams optimize. Fix: Use conservative estimates (5pp Year 1, 7pp Year 2+) and track actual improvements monthly. Adjust forecasts based on real data rather than vendor claims.Mistake 3: Using Gross Revenue Instead of Profit
Error: Calculating ROI based on total contract value rather than profit contribution. Fix: Apply realistic net profit margins (15-25% for most industries) to incremental revenue. A £1M contract at 20% margin contributes £200,000 to ROI calculation, not £1M.Mistake 4: Not Tracking Time Redeployment
Error: Assuming all saved time automatically converts to value. Reality: Time savings only create ROI if redirected to productive activities. If saved hours go unfilled, financial benefit is zero. Fix: Implement time tracking showing specifically where saved tender hours are reallocated. Measure the value created in those reallocated hours.Mistake 5: Incomplete Cost Accounting
Error: Only counting software subscription costs while ignoring training, implementation, process change management, and ongoing optimization. Fix: Build comprehensive cost model including:- Platform subscription
- Implementation services (if applicable)
- Training time (both initial and ongoing)
- Process refinement and optimization hours
- Integration costs with existing systems
- Data migration and cleanup
- Change management time
Total cost of ownership typically runs 140-180% of annual subscription costs in Year 1, dropping to 110-120% in subsequent years.
Mistake 6: Failing to Baseline
Error: Not accurately measuring current-state costs and performance, making before/after comparison impossible. Fix: Before implementing any new platform, rigorously document:- Current tender completion time by role (hour tracking across 5+ tenders)
- Current win rate (minimum 2 years history to establish baseline)
- Current external consultant spend
- Current technology costs
- Current revision cycles and non-compliance incidents
Without accurate baseline, ROI claims lack credibility.
Measuring & Tracking ROI (Implementation)
Theoretical ROI calculations mean nothing without measurement systems proving actual returns. Implement these tracking mechanisms:
Key Performance Indicators (KPIs)
Tier 1 - Financial Metrics (Monthly Tracking)- Win rate (overall and by tender type/value band)
- Contract value won
- Tender process costs (labor + external + technology)
- Cost per tender submitted
- Revenue per tender team FTE
- Average hours per tender by role
- Tender completion cycle time
- Revision cycles per tender
- Non-compliance rejections
- Template reuse rate
- Compliance score (% of requirements fully addressed)
- Evaluator feedback scores (when available)
- Response customization level
- Supporting evidence inclusion rate
Data Collection Methods
Time tracking: Implement simple time tracking for all tender-related activities. Tools like Harvest, Toggl, or custom spreadsheets work effectively. Require minimum 2-hour granularity—"worked on tender" is insufficient; capture "requirement mapping," "technical response drafting," "executive review," etc. Win/loss analysis: Record outcomes within 48 hours of notification. Beyond win/loss, capture evaluator scores (when provided), stated reasons for decision, and competitor intelligence. Monthly review sessions identify patterns driving results. Cost tracking: Monthly reconciliation of all tender-related expenses including software subscriptions, consultant invoices, training costs, and allocated labor (calculated from time tracking at fully-loaded rates). Quarterly ROI reviews: Every 90 days, recalculate actual ROI using real cost and benefit data. Compare to projections and investigate variances exceeding 15%. This identifies process improvements and validates business case accuracy.Sample ROI Dashboard
Create a single-page ROI dashboard updated monthly:
Costs YTD:- Labor: £XX,XXX (vs. £XX,XXX budget)
- Technology: £X,XXX (vs. £X,XXX budget)
- External: £XX,XXX (vs. £XX,XXX budget)
- Training: £X,XXX (vs. £X,XXX budget)
- Total: £XXX,XXX (vs. £XXX,XXX budget)
- Cost reduction: £XX,XXX
- Incremental wins: X contracts worth £X,XXX,XXX (£XXX,XXX profit)
- Time savings: XXX hours (£XX,XXX value)
- Risk avoidance: X prevented non-compliances (£XX,XXX value)
- Total: £XXX,XXX
- Win rate: XX.X% (vs. XX.X% baseline)
- Hours per tender: XX.X (vs. XX.X baseline)
- Cost per tender: £X,XXX (vs. £X,XXX baseline)
- Consultant usage: X engagements (vs. XX baseline)
This dashboard provides board-level visibility and maintains accountability for promised returns.
Building the Business Case
Whether justifying initial investment or defending continued spend, a compelling business case requires:
Executive Summary (1 Page)
The Opportunity: Clearly state the business problem. Example: "We currently win 16% of tenders, leaving £12.8M in potential annual contract value unrealized. Tender production costs £133,600 annually with 38% of bid manager time spent on repetitive tasks." The Solution: Specific investment request with clear scope. Example: "Implement mytender.io AI tender platform at £1,295/month (£15,540 annually) to improve win rates and reduce labor costs." The Returns: Conservative financial projections. Example: "Year 1 projected ROI of 185% (£28,750 net benefit) scaling to 295% (£45,840 net benefit) by Year 2. Payback achieved in 4.2 months." The Risks: Address objections proactively. Example: "Primary risks include 3-month learning curve and dependence on training data quality. Mitigation includes dedicated implementation support and phased rollout starting with 5 pilot tenders."Detailed Financial Model (2-3 Pages)
Present comprehensive cost-benefit calculations as shown earlier in this guide. Include:
- Current state costs (detailed breakdown)
- Proposed state costs (detailed breakdown)
- Benefits by category (conservative estimates)
- Sensitivity analysis (best/worst case scenarios)
- Multi-year projection (Years 1-3)
Risk Analysis & Mitigation (1 Page)
Implementation risk: Learning curve delays full productivity- Mitigation: Dedicated onboarding support, 20-hour training allocation, phased rollout
- Mitigation: Early team involvement in platform selection, clear "AI augments, not replaces" messaging, celebrate early wins
- Mitigation: Start with platform's pre-trained models, gradually build custom training set, accept lower Year 1 returns
- Mitigation: Pilot program with 5-8 tenders before full commitment, clear performance criteria for continuation, contract exit terms
Success Metrics & Governance (1 Page)
Define clear success criteria and tracking mechanisms:
Month 3 checkpoint:- Team trained and actively using platform
- 5+ tenders completed using new process
- Time per tender reduced by minimum 20%
- Win rate improvement of minimum 3 percentage points
- Cost per tender reduced by minimum 25%
- Team satisfaction score 7+/10
- ROI minimum 150%
- Win rate improvement minimum 5 percentage points
- Zero non-compliance rejections
Establish monthly ROI reviews with finance and quarterly executive updates.
mytender.io ROI: Real Customer Results
While benchmarks provide context, specific customer examples demonstrate achievable returns:
Facilities Management Company (32 employees, 18 tenders/year)
Before mytender.io:- Win rate: 14%
- Average tender completion: 52 hours
- Annual external consultant spend: £31,500
- Technology costs: £1,400/year
- Win rate: 22.5% (+8.5pp)
- Average tender completion: 28 hours
- Annual external consultant spend: £8,400
- Technology costs: £15,540/year (mytender.io)
- Cost savings: £23,100 (consultants) + £24,960 (labor, 432 hours @ £57.78/hour) - £14,140 (incremental tech) = £33,920
- Revenue impact: 1.5 additional wins × £650,000 average × 24% margin = £234,000
- Total benefit: £267,920
- Net investment: £14,140
- ROI: 1,794%
"The ROI was absurd—we paid for the platform in the first additional win. By month 12 we'd won contracts we would have never pursued before because the time investment was too high." — Operations Director
Construction Company (78 employees, 24 tenders/year)
Before mytender.io:- Win rate: 19%
- Average tender completion: 68 hours
- Annual external consultant spend: £48,000
- Technology costs: £2,100/year
- Win rate: 26.5% (+7.5pp)
- Average tender completion: 41 hours
- Annual external consultant spend: £14,500
- Technology costs: £15,540/year (mytender.io Professional)
- Cost savings: £33,500 (consultants) + £33,696 (labor, 648 hours @ £52/hour) - £13,440 (incremental tech) = £53,756
- Revenue impact: 1.8 additional wins × £1,200,000 average × 19% margin = £410,400
- Total benefit: £464,156
- Net investment: £13,440
- ROI: 3,354%
"We were skeptical about AI, but the compliance checking alone prevented two rejections in our first six months—each worth about £1.2M in potential contracts. That justified the entire investment." — Bid Director
Professional Services Firm (12 employees, 8 tenders/year)
Before mytender.io:- Win rate: 21%
- Average tender completion: 44 hours
- Annual external consultant spend: £18,000
- Technology costs: £600/year
- Win rate: 28% (+7pp)
- Average tender completion: 26 hours
- Annual external consultant spend: £5,000
- Technology costs: £5,940/year (mytender.io Essentials)
- Cost savings: £13,000 (consultants) + £7,488 (labor, 144 hours @ £52/hour) - £5,340 (incremental tech) = £15,148
- Revenue impact: 0.56 additional wins × £420,000 average × 32% margin = £75,264
- Total benefit: £90,412
- Net investment: £5,340
- ROI: 1,593%
"As a small team, we couldn't justify a dedicated bid writer. mytender.io gives us enterprise-level capabilities at a price that makes sense for 8 tenders a year." — Managing Director
These results are representative but not guaranteed. Individual outcomes depend on baseline efficiency, tender quality, team adoption, and market conditions.
ROI Optimization Strategies
Achieving strong ROI isn't automatic—it requires deliberate optimization:
Strategy 1: Focus on High-Impact Tenders First
Don't spread AI platform usage across all opportunities equally. Prioritize high-value tenders (top 30% by contract value) and complex tenders (historically requiring external consultants) during the first 3-6 months.
This concentrates learning on opportunities with largest ROI impact while allowing the team to develop proficiency before applying to lower-stakes bids.
Strategy 2: Build Quality Training Data Systematically
AI platforms improve through exposure to your winning content. Systematically upload your best 10-15 winning tenders from the past 24 months, along with evaluator feedback when available.
Dedicate 2-3 hours monthly to reviewing AI-generated content and providing quality ratings. Platforms like mytender.io use this feedback to continuously improve relevance and effectiveness.
Strategy 3: Reallocate Saved Time Strategically
Every hour saved through AI efficiency is an hour available for higher-value activities. Organizations achieving highest ROI deliberately reallocate saved time to:
- Additional tender opportunities (42% of saved time on average)
- Enhanced bid quality and customization (28%)
- Strategic business development (18%)
- Process improvement and innovation (12%)
Create explicit time reallocation plans rather than assuming saved hours automatically create value.
Strategy 4: Reduce External Dependency Gradually
Don't eliminate all external consultants immediately. Use a phased approach:
Months 1-3: Maintain current consultant usage while building AI proficiency Months 4-6: Reduce consultant usage by 40% on mid-complexity tenders Months 7-12: Reduce by 60-70% overall, maintaining consultants only for highly specialized technical contentThis gradual transition builds confidence while preventing quality regression.
Strategy 5: Measure and Communicate Wins
Track every prevented non-compliance, every hour saved, and every incremental win. Communicate these results to leadership monthly to maintain organizational support and justify continued optimization investment.
Create brief case studies (2-3 paragraphs) for significant wins where AI played a measurable role. This builds institutional credibility and encourages broader adoption.
Conclusion: Making ROI-Driven Decisions
Tender writing represents a significant organizational investment whether you optimize it or not. The £133,600 average annual cost for mid-market organizations demands strategic attention rather than allowing processes to evolve organically.
AI tender platforms like mytender.io deliver measurable ROI—typically 185-385% depending on organizational context—but only when implemented with clear objectives, comprehensive measurement, and deliberate optimization.
Use the frameworks in this guide to:
- Calculate your current tender costs comprehensively (most organizations underestimate by 40-60%)
- Establish realistic benefit projections (conservative estimates build credibility)
- Build a defensible business case (show your work with detailed assumptions)
- Implement rigorous tracking (measure what you promise)
- Optimize continuously (Year 2-3 ROI exceeds Year 1 through learning)
Whether justifying investment to your board, evaluating platforms, or optimizing current tools, let ROI be your guide. The organizations winning more tenders aren't guessing—they're measuring, optimizing, and outperforming competitors through systematic advantage.
Start by calculating your current tender costs using the framework above. Most organizations discover significant opportunities in categories they weren't tracking. That awareness alone drives better decisions.
---
Ready to calculate your specific ROI? Try mytender.io free for 14 days and track your actual time savings, improved compliance, and win rate changes with real data. Our platform includes built-in ROI tracking dashboards showing exactly where you're gaining value. Need help building your business case? Our team provides complimentary ROI analysis based on your specific tender profile, contract values, and current win rates. Contact us to receive a customized financial model.Tags
Ready to Transform Your Tender Writing?
See how MyTender's AI can help you write winning tenders in a fraction of the time.