

How to Calculate Your True Bid Win Rate (And What to Do With It)
Most companies track win rate wrong. Here is how to calculate it properly, what the numbers actually mean, and the steps that move the needle.
mytender.io Research Team
Tender Writing & Bid Management Specialists
How to Calculate Your True Bid Win Rate (And What to Do With It)
Most commercial leaders think they know their bid win rate. Most are wrong.
Ask a sales director what their win rate is and you usually get a confident answer. Ask how it is calculated and the confidence wobbles. Ask what they did with the number last quarter and the room goes quiet.
A win rate is meant to tell you how well your bid function is performing. In practice, most of the numbers floating around boardrooms tell you something much less useful. They tell you how busy the team is, not how good they are.
This guide is for commercial directors, MDs and CCOs who want a number they can actually run a business on. We will walk through the right formula, the common ways teams get it wrong, realistic UK benchmarks, and the levers that actually move it.
The Basic Formula (And Why It Is Not Enough)
The textbook calculation is simple.
Win Rate = (Contracts Won / Total Bids Submitted) x 100Submit 20 bids, win 6, that is a 30 percent win rate. Easy maths, neat number, fits in a board pack.
The problem is that not all bids are equal. A £5,000 win counts the same as a £500,000 win. A bid you were always going to lose counts the same as one you should have nailed. Two teams with identical 30 percent win rates can have wildly different commercial outcomes.
For commercial leaders, a far more useful metric is the Weighted Win Rate.
Weighted Win Rate = (Value of Contracts Won / Value of Contracts Bid) x 100Now you are measuring money, not paperwork.
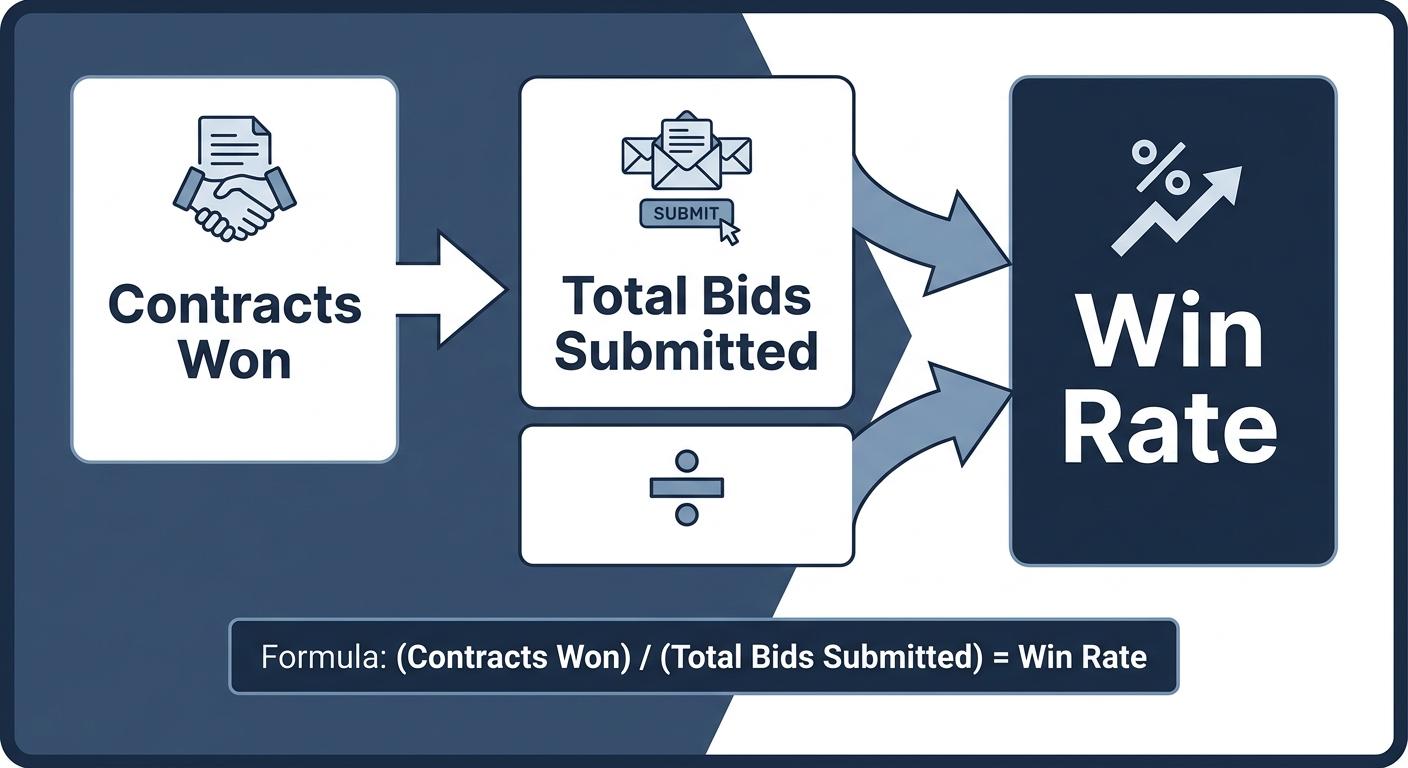
Bid win rate formula diagram showing contracts won divided by total bids submitted
Here is a worked example. A mid-market FM contractor submits 20 bids in a quarter, totalling £12m of contract value. They win 6 bids worth £4.8m.
By the basic formula, their win rate is 30 percent. By the weighted formula, it is 40 percent. Same activity, very different story. The team is winning the bids that matter. Now imagine the inverse: 30 percent volume, 18 percent value. Same team on paper, very different conversation in the boardroom.
If your finance director cares about revenue and not bid count, weighted win rate is the metric that matches their world.
Why Most Companies Track It Wrong
When we audit bid functions, we see the same handful of mistakes again and again.
They include the no-hopers. Every bid the team should have walked away from gets dropped into the denominator. Fishing expeditions, courtesy bids to keep a buyer happy, bids submitted out of fear of missing out. None of them were ever going to win, but they all drag the headline number down and obscure how good the team actually is on the bids that mattered. They ignore value. Counting bids as units treats a tiny lot the same as a transformational framework. If your team is winning lots of small bids and losing the big strategic ones, your numbers look healthy while your pipeline quietly bleeds out. They do not segment. A single blended win rate hides everything useful. You need to see the number by sector, by buyer type, by lot size, by bid writer, by client tier. The blended number is a vanity metric. The segmented numbers are where the insight lives. They do not separate new business from renewals. Winning a recompete you already deliver is not the same as winning a new logo from a cold start. They take different effort and they tell you different things. Tracking them together flatters the easy ones and punishes the hard ones. They count bids that should never have been entered. This is the big one. If your go/no-go process is broken, you are entering bids you should have declined, which means you are losing them, which means your win rate looks worse than your actual sales capability.UK Benchmarks (And Why They Are Less Useful Than You Think)
If you want a rough orientation, here is what we see across UK markets.
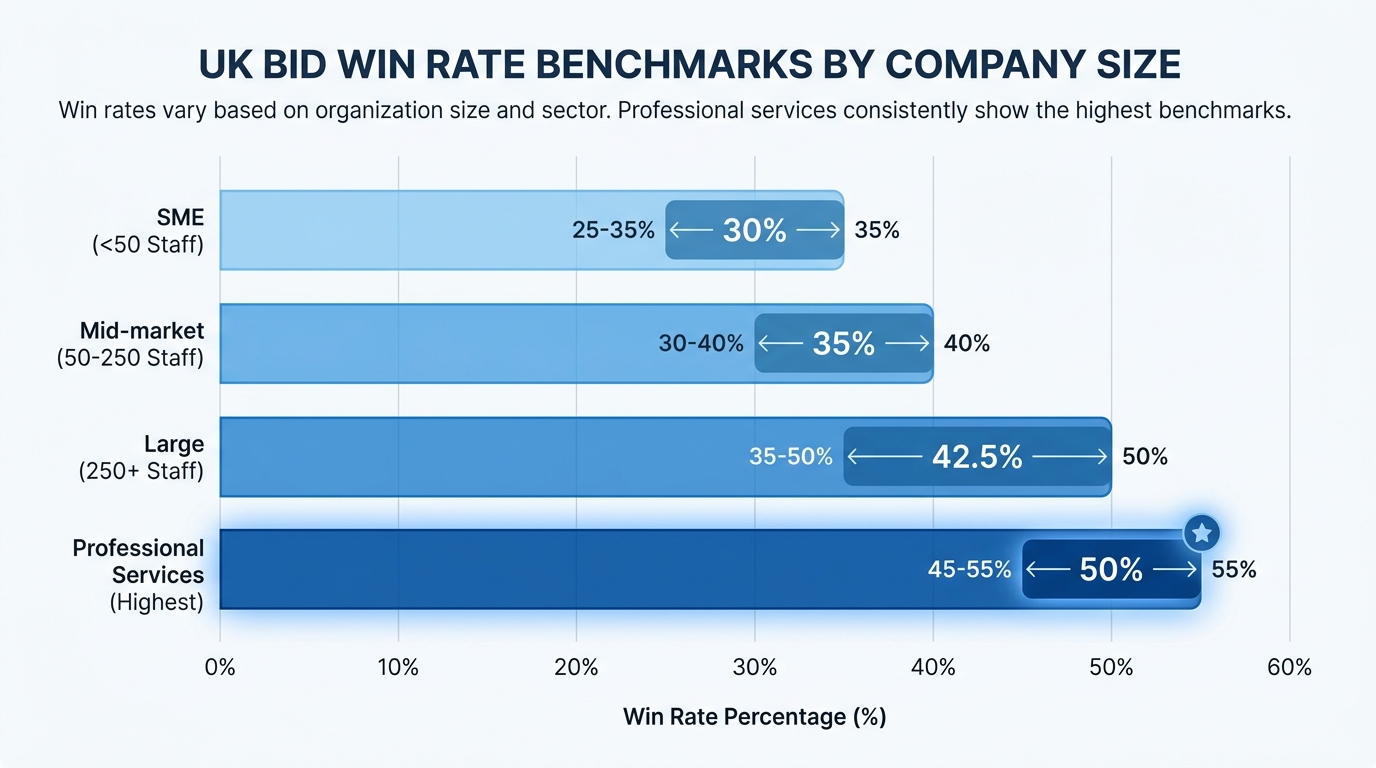
UK bid win rate benchmarks by company size and sector
- SMEs (under 50 staff): typically 25 to 35 percent on public sector work, higher on private
- Mid-market (50 to 250 staff): 30 to 40 percent on competitive tenders
- Large enterprises (250+ staff): 35 to 50 percent, with the upper end driven by incumbency and framework positions
- Professional services: often 45 to 55 percent, because they bid selectively and bring sector reputation
- Construction main contractors: often lower, 15 to 25 percent, because the competitive set is large and price sensitivity is high
- Facilities management: 25 to 35 percent on competitive tenders, higher on recompetes
These ranges are useful for sanity checks. They are not useful as targets.
Why? Because two FM firms in the same band can have radically different commercial reality. One is bidding three transformational national contracts a year and winning one. The other is churning through 80 small council bids and winning 20. Same win rate, very different business.
Benchmarks tell you the neighbourhood. They do not tell you whether your house is in good order.
The Go/No-Go Decision Is the Biggest Lever
If you want to move your win rate next quarter, the fastest route is not better writing or smarter pricing. It is bidding on fewer things.
The instinct is the opposite. Pipeline pressure pushes teams to bid on everything that looks vaguely relevant. A disciplined go/no-go process pushes back.
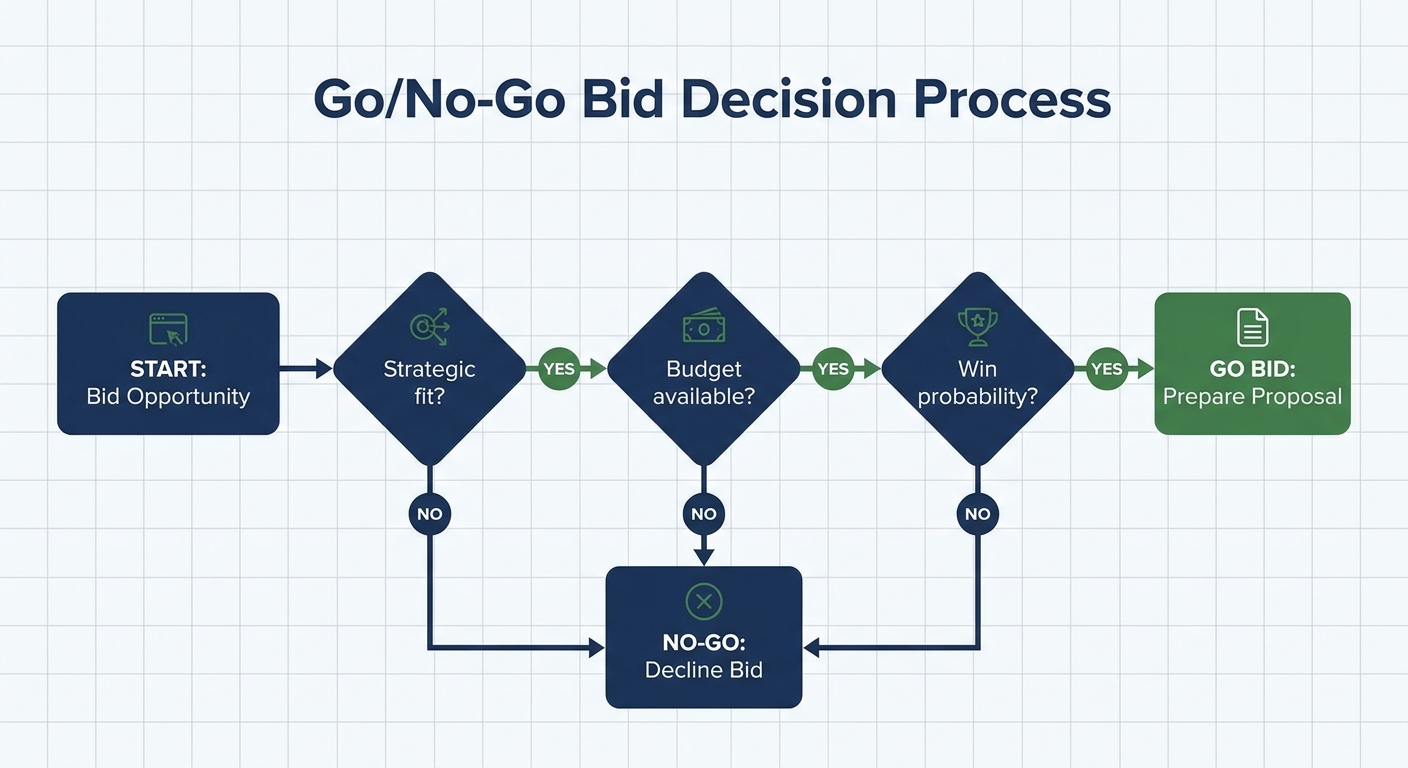
Go/no-go bid decision flowchart with strategic fit, budget and win probability checks
A working go/no-go process answers four questions before a single hour goes into the response.
Do you know the buyer? Have you delivered to them before, met them at industry events, or had a pre-market engagement? If the buyer does not know who you are, your conversion rate drops sharply. That does not mean you never bid cold, but it means you need a much stronger case to justify the effort. Is the specification written around someone else? Read it carefully. Look for unusually specific requirements that only one supplier could meet. Look for incumbents who have shaped the buyer's thinking. If the bid feels wired, it probably is. Do you have relevant, recent, evidenced experience? Not similar experience. Relevant. Recent. Evidenced. If you cannot point to two or three case studies that map directly onto the requirement, you are not the right answer to the buyer's question. What is your realistic win probability? Not your hope. Your evidenced probability. Below 20 percent, you should have a very specific strategic reason to bid. Below 10 percent and you are buying lottery tickets with your team's time.A scoring sheet helps. Weight the criteria, set a threshold, and decline bids that fall below it. The hard part is not the scoring. The hard part is having the discipline to walk away when sales pipeline pressure tells you to chase everything.
The Priority Matrix
For the bids that do clear go/no-go, not all of them deserve equal effort. A priority matrix helps you allocate where the team's best brains go.
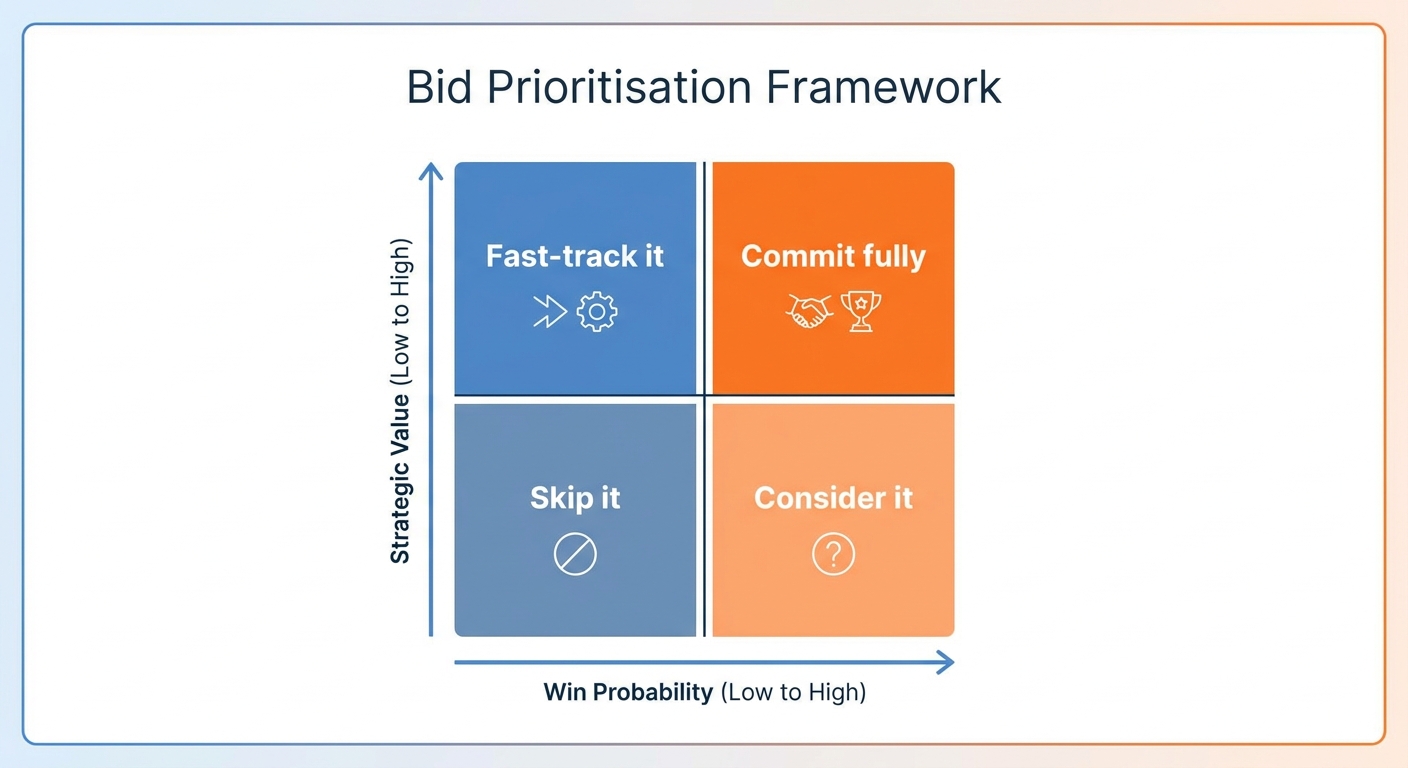
Bid prioritisation quadrant matrix showing win probability versus strategic value
Plot every live bid on two axes: win probability on the horizontal, strategic value on the vertical. You get four zones.
Skip it (low probability, low value): You should not be bidding this. If it cleared go/no-go, your scoring is too generous. Consider it (low probability, high value): A long shot on a big prize. Worth a lean response with senior input, but do not over-invest. Treat it as planting a seed for next time if you lose. Fast-track it (high probability, low value): Quick wins. Use templates, lean approval, junior team. Convert the volume without consuming senior bandwidth. Commit fully (high probability, high value): This is where the senior team earns their money. Full kick-off, dedicated bid manager, executive sponsor, time invested in colour reviews. These are the bids you cannot afford to lose.The matrix is not a science. It is a forcing function for conversations about effort allocation. If everything ends up in "commit fully" you have not got a matrix, you have a wish list.
The Improvement Loop
A win rate number is only useful if you do something with it. Most companies measure, file the spreadsheet, and carry on. The teams that actually improve their win rates have a closed loop.
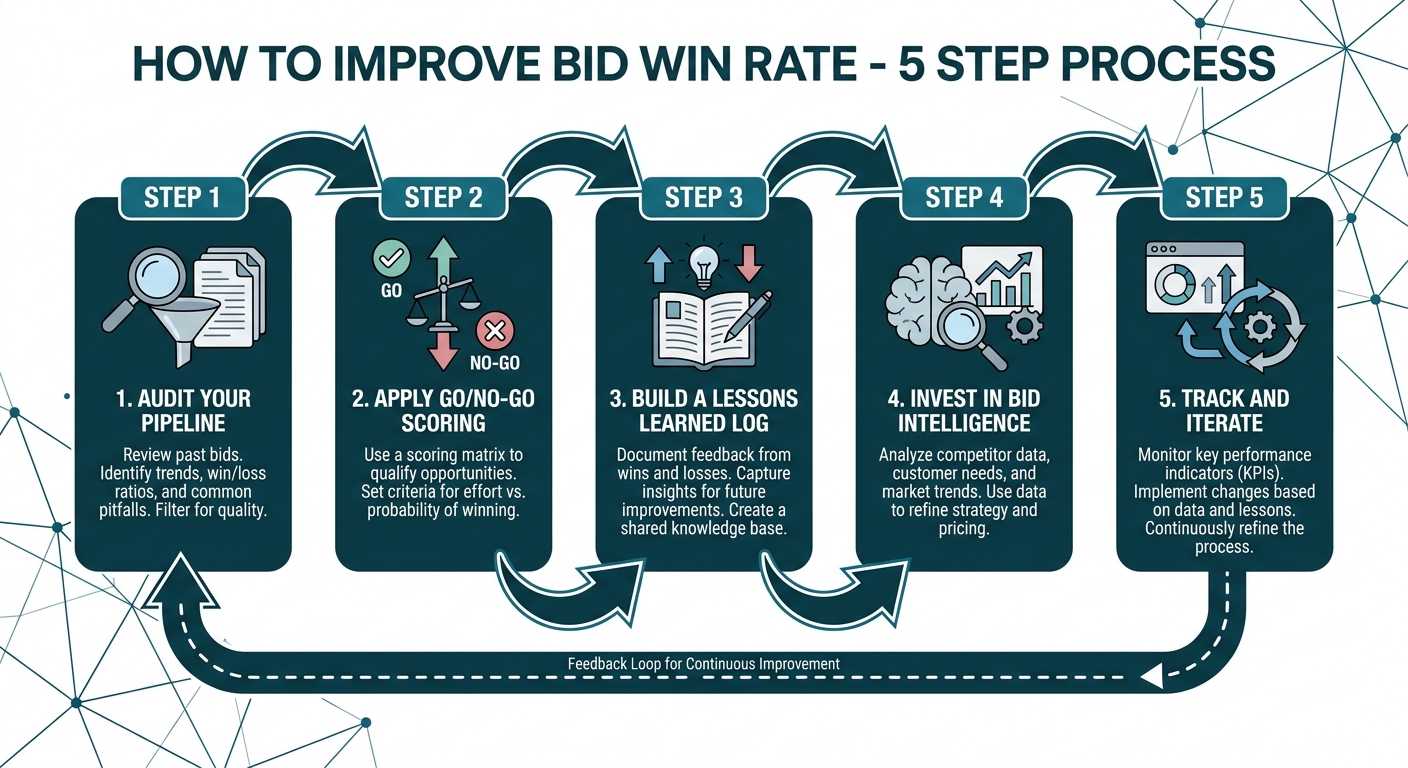
Five-step improvement process: audit pipeline, apply go/no-go, build lessons learned, invest in intelligence, track and iterate
The teams that do this for 18 months tend to lift their weighted win rate by 5 to 10 percentage points. That is not magic. It is the compounding effect of saying no more often and doing the remaining work properly.
How AI Is Changing the Maths
There is a layer above all of this that did not exist three years ago. AI-driven bid platforms now do two things that materially affect win rate.
First, they raise the floor. A first draft from a well-trained AI bid system is significantly better than the average mid-week draft a stretched team produces. That means even the bids you treat as "fast-track it" come out of the door at a higher quality than they used to.
Second, they make the knowledge library actually usable. The classic bid library is a graveyard of out-of-date case studies that nobody can find. A modern AI bid platform indexes everything, surfaces the most relevant past content for each new question, and lets writers spend their time on the parts of the response that need real thinking.
The net effect on win rate is not dramatic at first. The dramatic shift is in what the team can take on. Teams that previously bid 30 a year now bid 50, with better quality, and the win rate holds or improves. That is when the commercial picture changes.
Where to Start
If you take three things from this article, take these.
Calculate your weighted win rate, segmented by sector and buyer type, for the last 12 months. The number will tell you something the headline win rate has been hiding.
Build a go/no-go rubric and have the courage to use it. The fastest way to improve your win rate is to stop entering bids you should not be entering.
Treat win rate as a leading indicator, not a scorecard. The number on its own is useless. The conversation it should trigger about pipeline quality, effort allocation and process maturity is where the value sits.
A good bid function is not the one that submits the most. It is the one that wins the right work, at the right price, with the right effort. The win rate, properly calculated, is the cleanest signal of whether you have got that right.
Take the Next Step
If you want to see where your win rate could be heading with better tooling and a smarter pipeline, explore Tender Finder. It helps commercial teams spot the right opportunities sooner, qualify them faster, and stop their best people drowning in bids they were never going to win.
You can also request a demo of mytender.io to see how AI-assisted bid writing changes the quality and capacity equation for your team.
Tags
Ready to Transform Your Tender Writing?
See how MyTender's AI can help you write winning tenders in a fraction of the time.